When Canopy Investors was founded, we started with a blank sheet of paper and asked ourselves a fundamental question: where can we best apply our expertise to generate exceptional investing outcomes for clients?
Guided by the wisdom of Charlie Munger, we decided to focus solely on global small and mid (SMID) cap companies. This often-overlooked segment of the market, in this context representing the bottom ~30% of total market capitalisation within each country, has historically outperformed and offers a rich opportunity set for active investors.
Historical outperformance of smaller companies
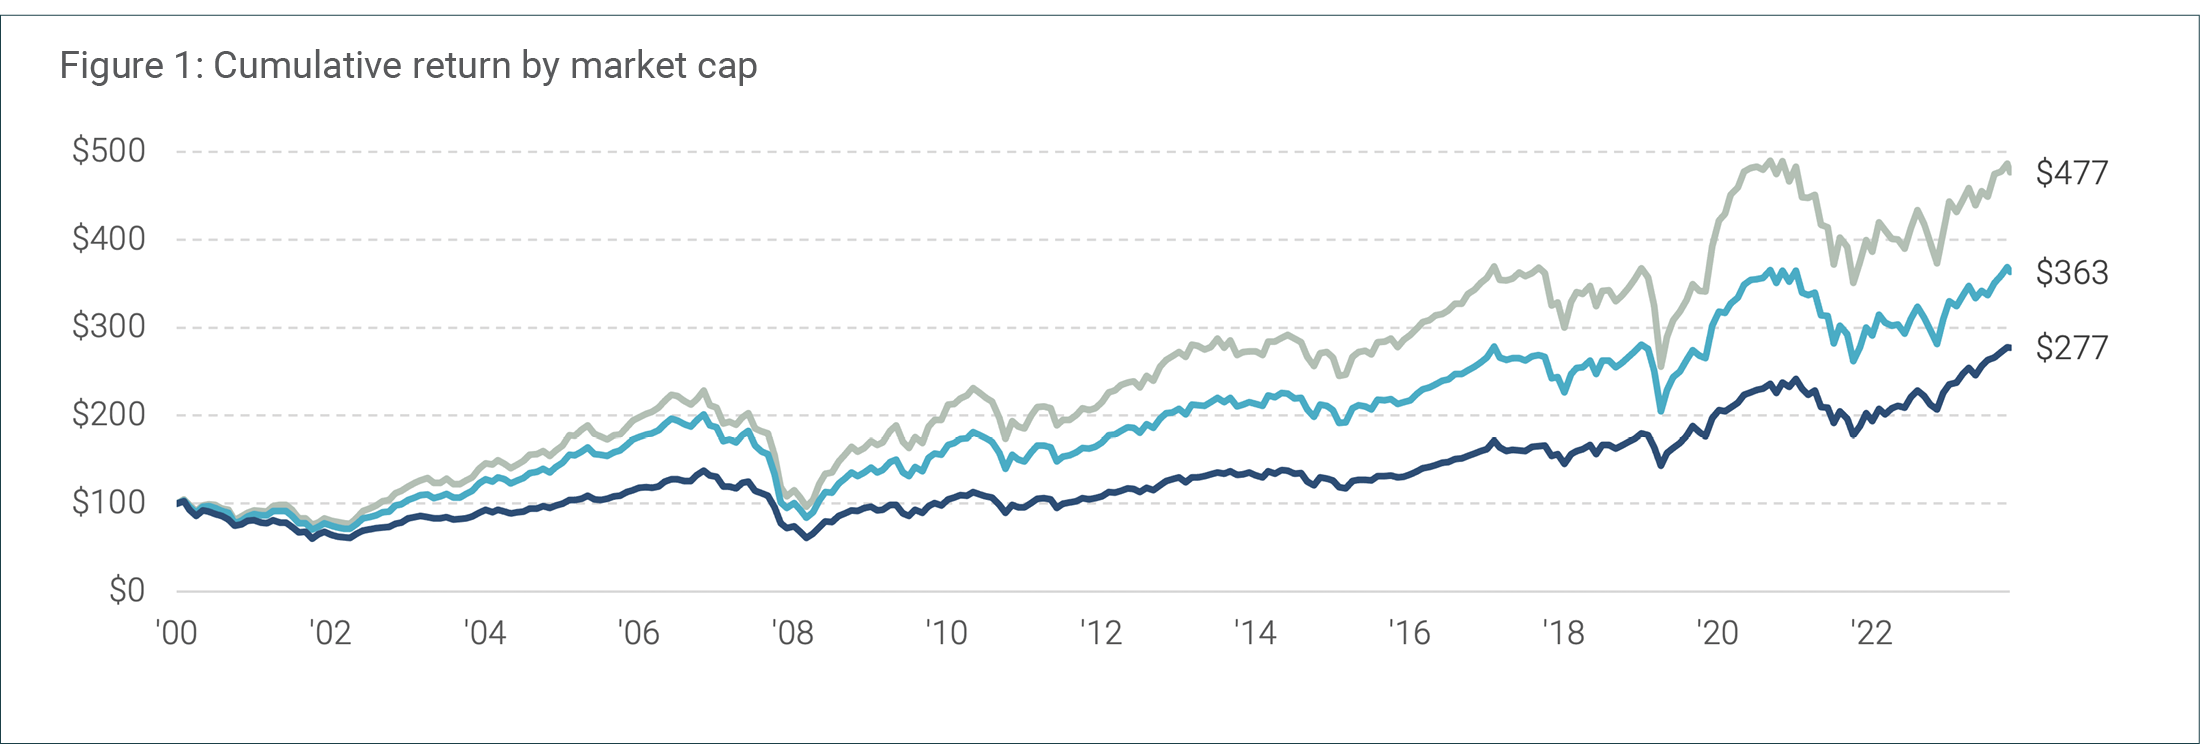
Smaller companies have historically outperformed their larger counterparts. The chart below shows the cumulative performance of the MSCI World Small, Mid and Large Cap indices from January 2001 through September 2024. A $100 investment in the small and mid-cap indices at the beginning of this period would now be worth $477 and $363, respectively, versus $277 for the large cap index. In addition to higher cumulative returns, both the small cap and mid cap indices demonstrated superior risk-adjusted performance over this period, with Sharpe ratios[1] of 0.35 and 0.30 respectively, compared to 0.28 for the large cap index.


The outperformance of smaller companies is not a recent phenomenon; Banz (1981) empirically demonstrated small-cap outperformance using a dataset going back to the 1920s. More importantly, small-cap outperformance has been found to persist even on a risk-adjusted basis. In their seminal paper, Fama and French (1992) incorporated size into their three-factor model alongside market beta and the value factor (book-to-market ratio), and found that the small-cap premium remained significant, even after controlling for these risk factors.
More recently, Asness et al. (2018) found that the size effect was stronger when controlling for “quality” or “junk” characteristics (defined by a combination of metrics describing profitability, growth, leverage, and the ability to payout earnings). They showed that small quality stocks significantly outperformed large quality stocks.
In our view, the historical outperformance of smaller companies is intuitive, and potentially attributable to several factors:
- Higher growth and longer runways: unlike larger companies constrained by the "law of large numbers," smaller firms can sustain higher growth rates for longer periods. Furthermore, their size allows them to capitalise on niche opportunities and untapped markets that larger companies might overlook or find difficult to pursue.
- Greater potential for takeovers: small companies frequently become acquisition targets for larger firms seeking to diversify, enter new markets, or acquire innovative technologies. This takeover potential can create substantial upside for investors, as acquisitions often come with a premium over market value (Andrade et al., 2001).
- Founder-driven focus: many small companies are still led by their founders, who often have a strong vision and personal stake in the company's success. This can drive innovation and long-term strategic thinking that may be less prevalent in larger, more established corporations.
A rich opportunity for active investors
What’s more, the global SMID investment universe exhibits structural characteristics that create opportunities for active managers to generate further outperformance.
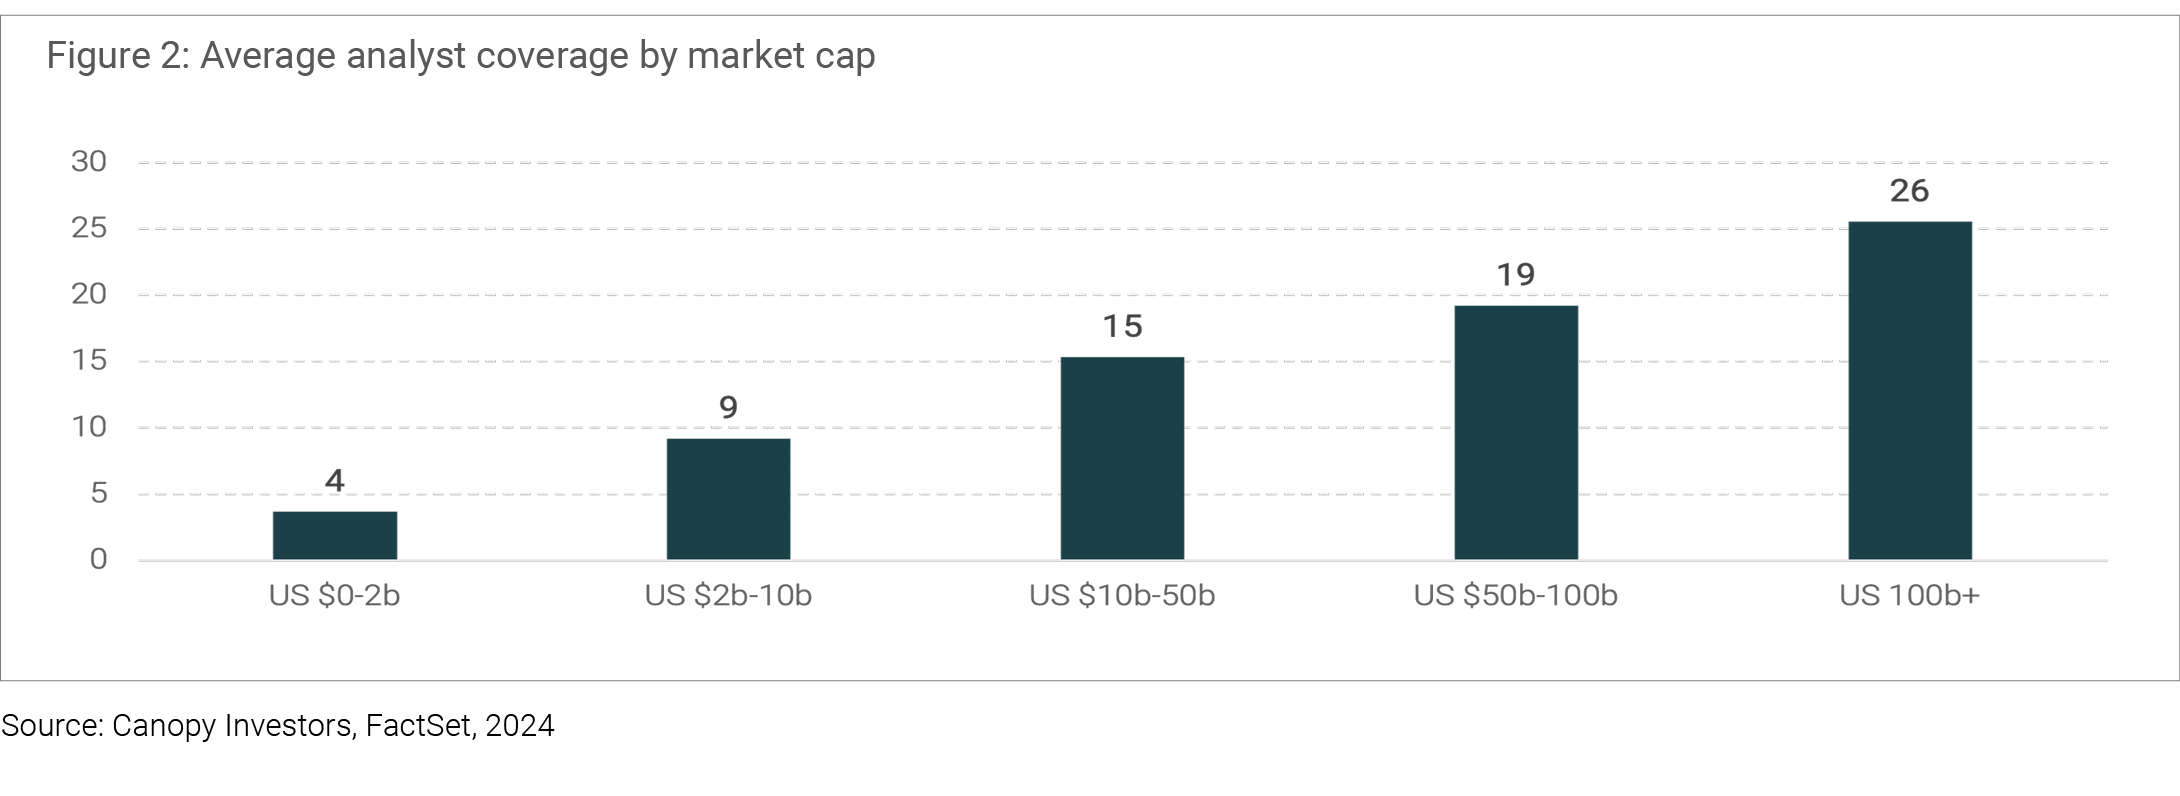
- Limited analyst coverage: smaller companies typically receive less attention from sell-side analysts and institutional investors, resulting in a greater dispersion of expectations and potential mispricings, providing opportunities for diligent investors.

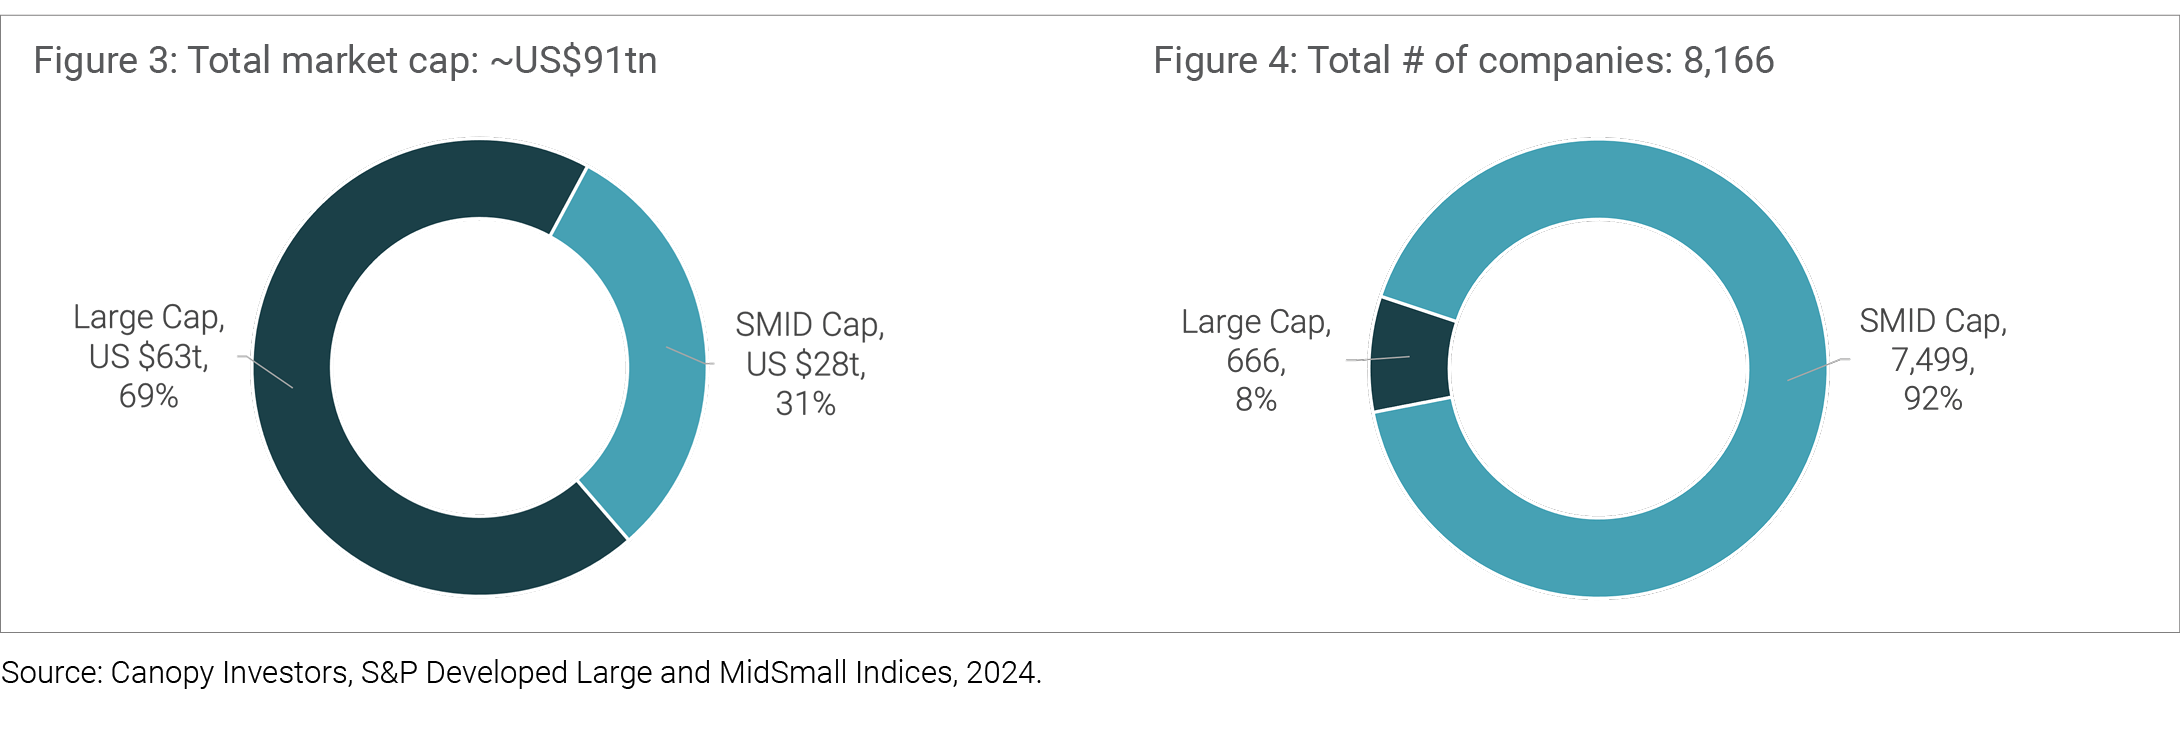
- Larger, more diverse investment universe: the SMID segment offers a vast and diverse set of investment opportunities across various geographies, sectors and business models, providing opportunities for manager differentiation. The charts below illustrate the contrast between market capitalisation and the number of companies in the large-cap versus SMID segments. Large cap stocks account for ~70% of the ~US$91tn global developed markets market cap, with increasing concentration in large-cap indices in recent years, while SMID stocks comprise the majority of listed companies.

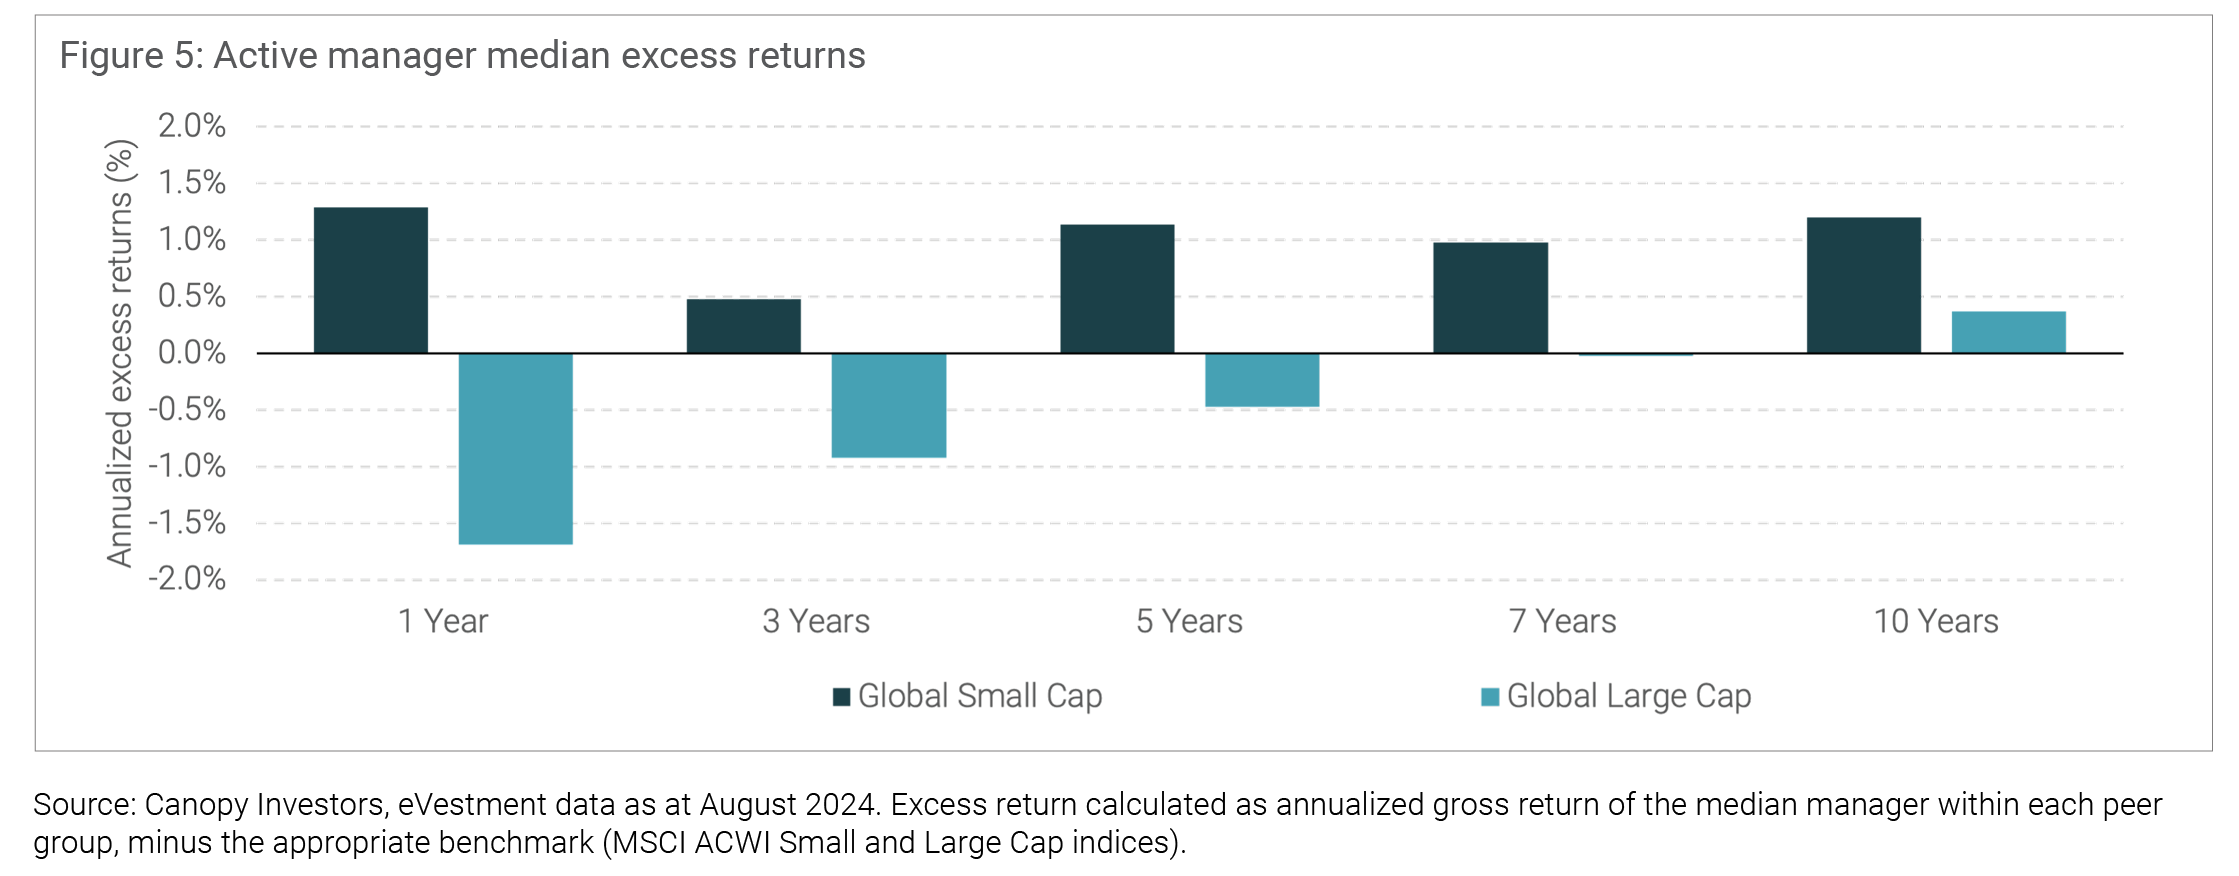
- As highlighted in the chart below, there is some evidence that these factors have contributed to more persistent outperformance by small-cap active managers.

An enduring opportunity
In sum, smaller companies have a track record of delivering strong returns, particularly when coupled with a quality overlay. There are structural reasons to suggest that these results are persistent. By focusing on this often-overlooked market segment, our aim is to deliver exceptional outcomes for clients, staying true to the principle of "fishing where the fish are."
The content contained in this article represents the opinions of the authors. This commentary in no way constitutes a solicitation of business or investment advice. It is intended solely as an avenue for the authors to express their personal views on investing and for the entertainment of the reader.
[1] Sharpe ratio is a measure of risk-adjusted return, calculated by subtracting the risk-free rate from the investment's average return, then dividing by the standard deviation of the investment's returns.
Andrade, Gregor, Mark Mitchell, and Erik Stafford. (2001). "New Evidence and Perspectives on Mergers." Journal of Economic Perspectives, 15 (2), 103-120.
Banz, R. W. (1981). "The Relationship Between Return and Market Value of Common Stocks." Journal of Financial Economics, 9 (1), 3-18.
Fama, E. F., & French, K. R. (1992). "The Cross-Section of Expected Stock Returns." Journal of Finance, 47(2), 427-465.
Asness, C., A. Frazzini, R. Israel, T. J. Moskowitz, and L. Pedersen. 2018. "Size Matters, If You Control Your Junk." Journal of Financial Economics 129 (3): 479–509.
