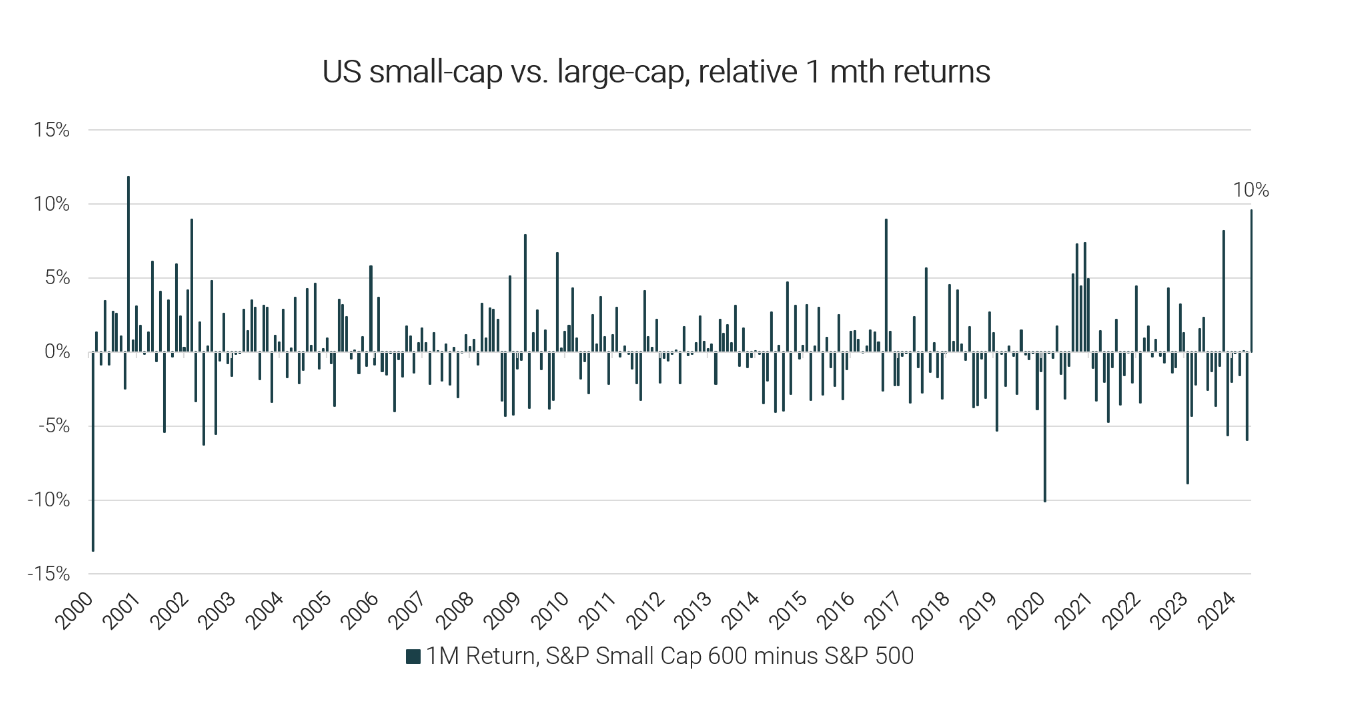
The S&P Small Cap 600 index surged 11% in July, while the S&P 500 - dominated by mega-cap tech companies - increased by 1 %[1]. As shown below, this 10% spread marked the largest monthly outperformance of small-caps versus large-caps in over two decades.

Source: Canopy Investors, Factset
Such a significant move has understandably prompted speculation about an impending 'Great Rotation' from large-caps to small-caps. While the subsequent pullback in early August has tempered some of this enthusiasm, it doesn't negate the potential for longer-term shifts in market leadership.
At Canopy, we think it’s important to understand this result in a longer-term context.
Despite weak performance over the last decade, over the long term, U.S. small-caps have outperformed large-caps
The historical outperformance of small-caps versus large-caps has been well documented. The Fama and French dataset, spanning back to 1927, shows that the US small-cap factor delivered an average annual outperformance of +285 basis points[2]. However, the past decade has diverged from this trend, with large-caps, led by US technology stocks, significantly outpacing small-caps. Consequently, despite their recent gains, small-caps still lag well behind over this period.
U.S. small-caps remain at a generational valuation discount to U.S. large-caps
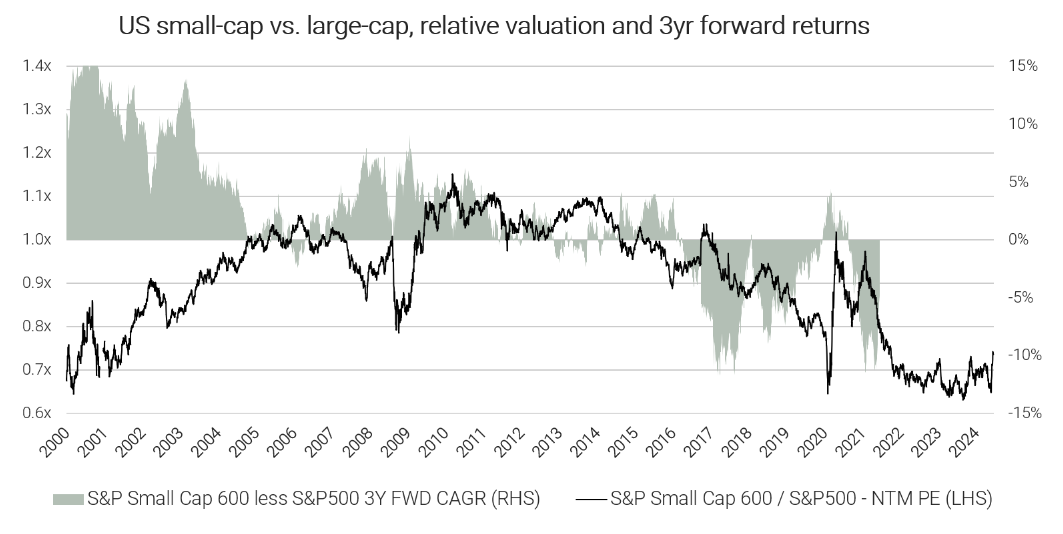
The underperformance of small-caps in recent years has also outpaced the decline in their earnings estimates, resulting in a de-rating relative to large-caps. In fact, the spread between small-cap and large-cap P/E multiples has now widened to levels not seen since the dot-com bubble of the late 1990s.
Historically, such extreme valuation disparities often preceded periods of small-cap outperformance. As shown in the chart below, the excess return of small-caps versus large-caps over the subsequent three years tended to be largest when the relative valuation of small-caps was most depressed, as was similarly the case in the early 2000s.

Source: Canopy Investors, Factset
With U.S. stocks representing ~70% of global small and mid-cap market cap, we think the U.S. experience is highly relevant to the global universe in which Canopy invests, and we believe there is further scope for small-caps to outperform from current levels moving forward.
[1] Canopy Investors, Factset.
[2] Kenneth R. French Data Library. Fama/French 3 Factors annual observations.
The content contained in this article represents the opinions of the authors. The authors may hold either long or short positions in securities of various companies discussed in the article. The commentary in this article in no way constitutes a solicitation of business or investment advice. It is intended solely as an avenue for the authors to express their personal views on investing and for the entertainment of the reader.
